Integrated management and optimization system for logistics facilities
Progress Management, Workload Forecasting & Analysis by GWES
Overview
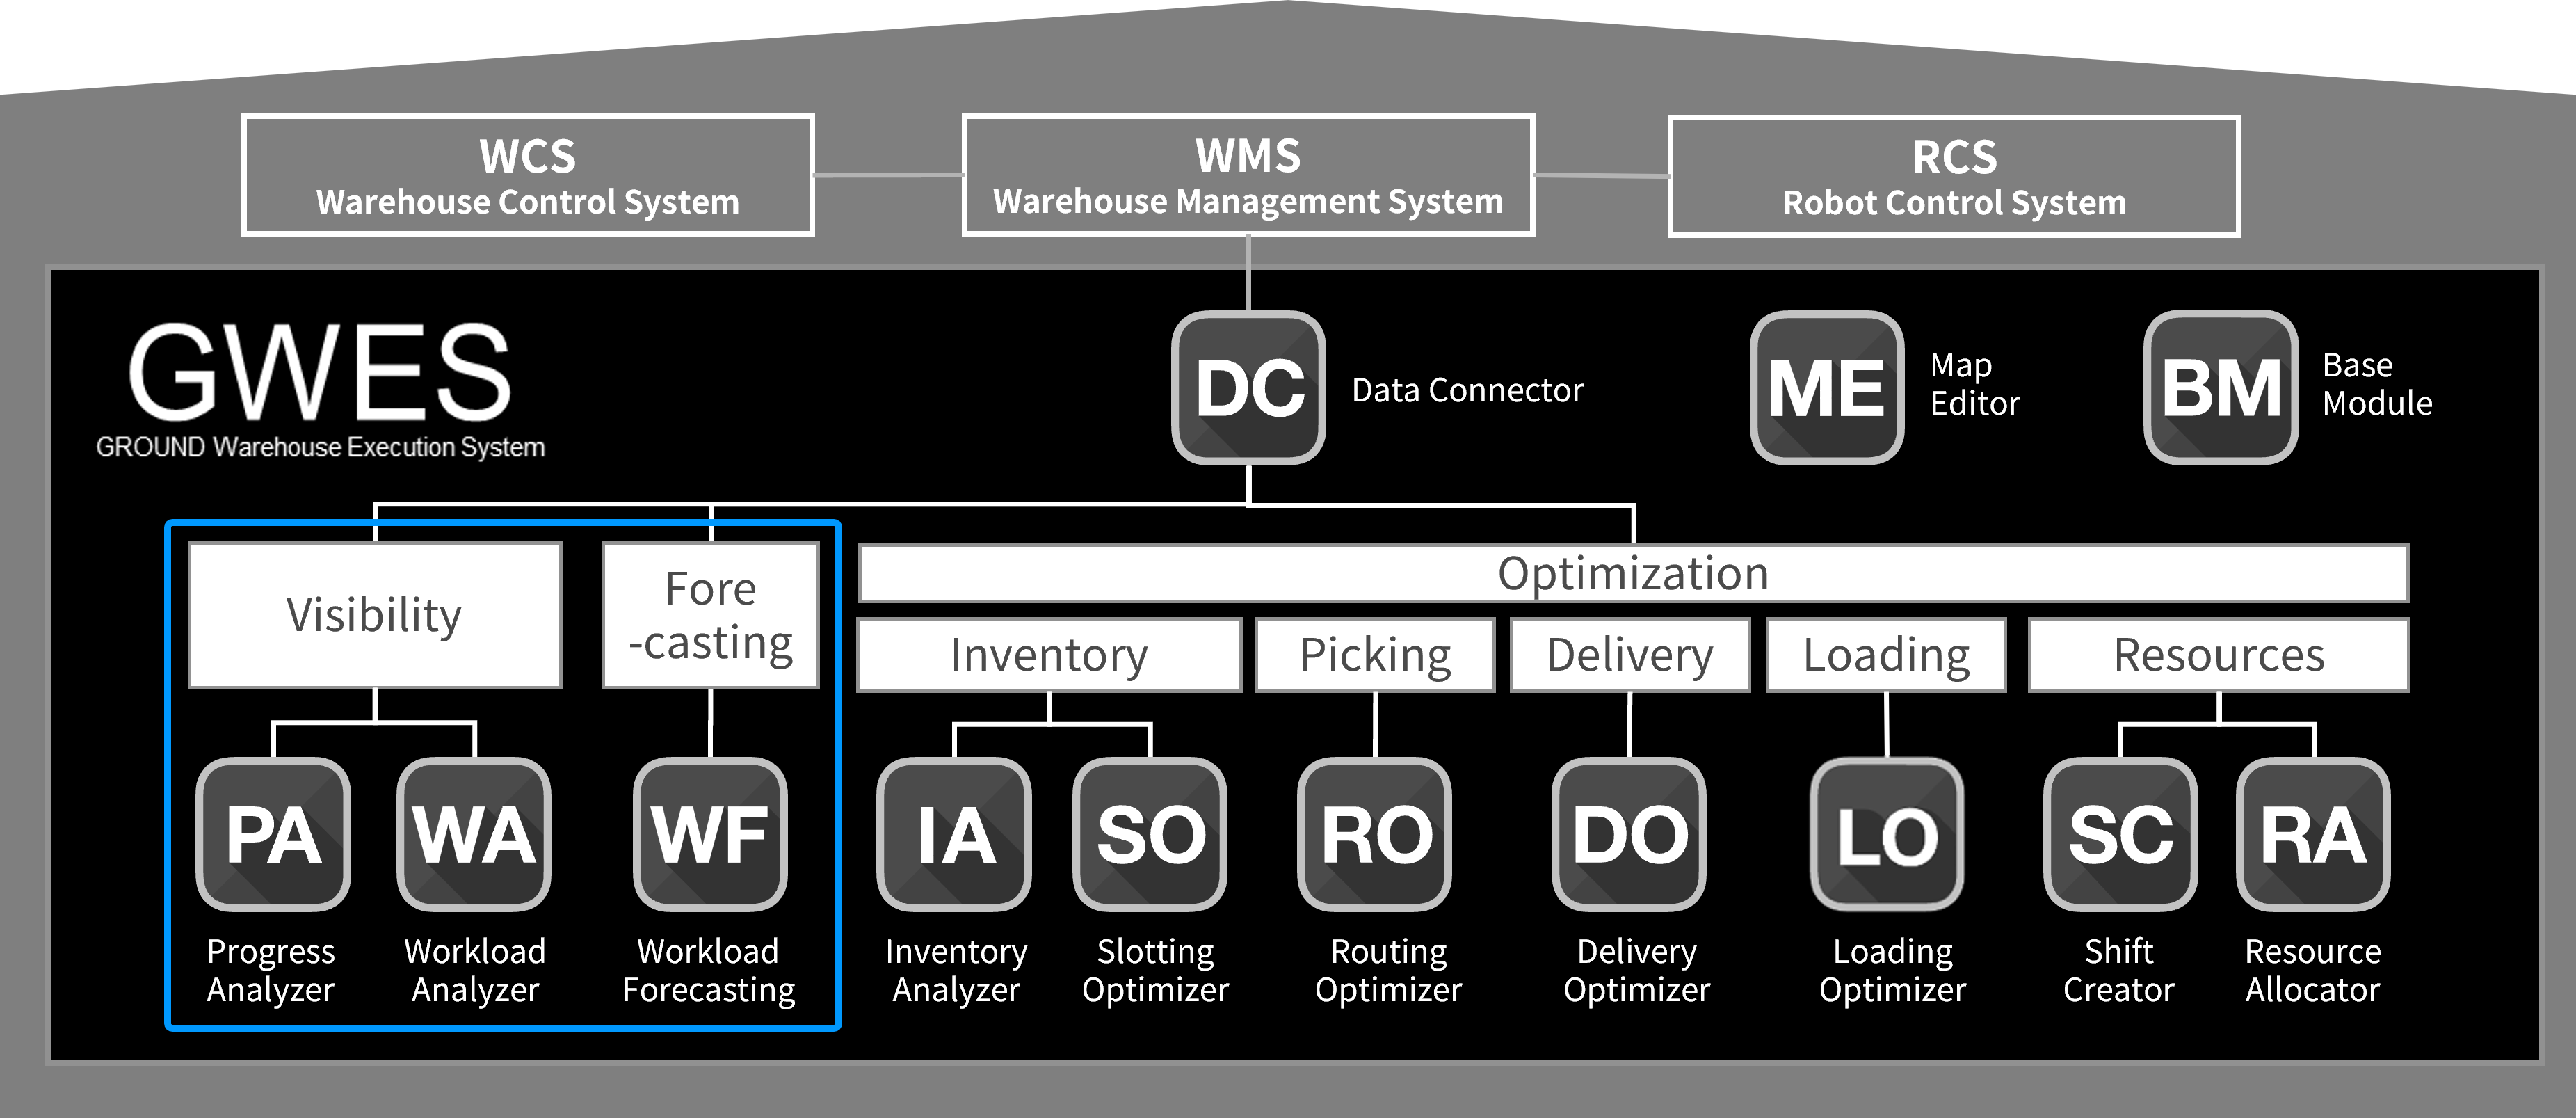
GWES, the integrated management and optimization system for logistics facilities, supports progress management, workload forecasting and analysis to ensure smooth execution of operations in each process in logistics facilities and to improve productivity and work efficiency.
-

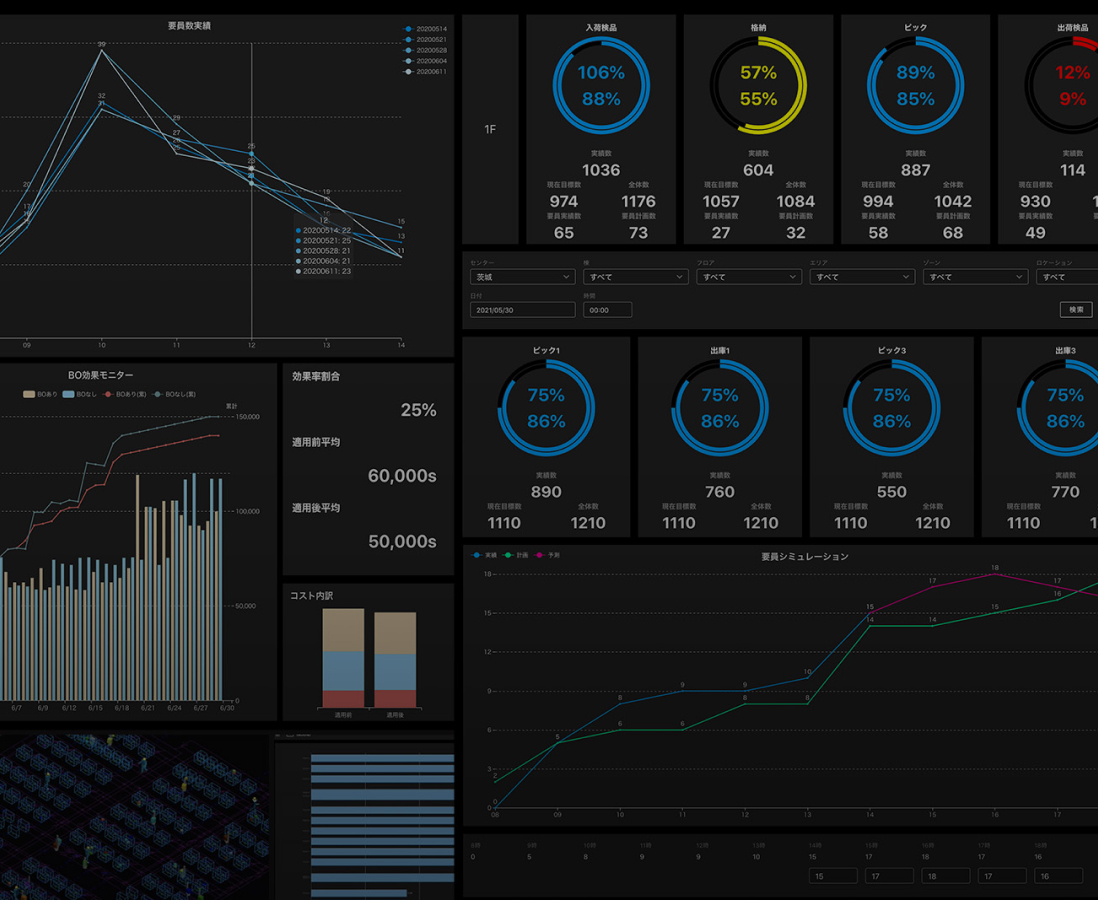
Progress Analyzer
-

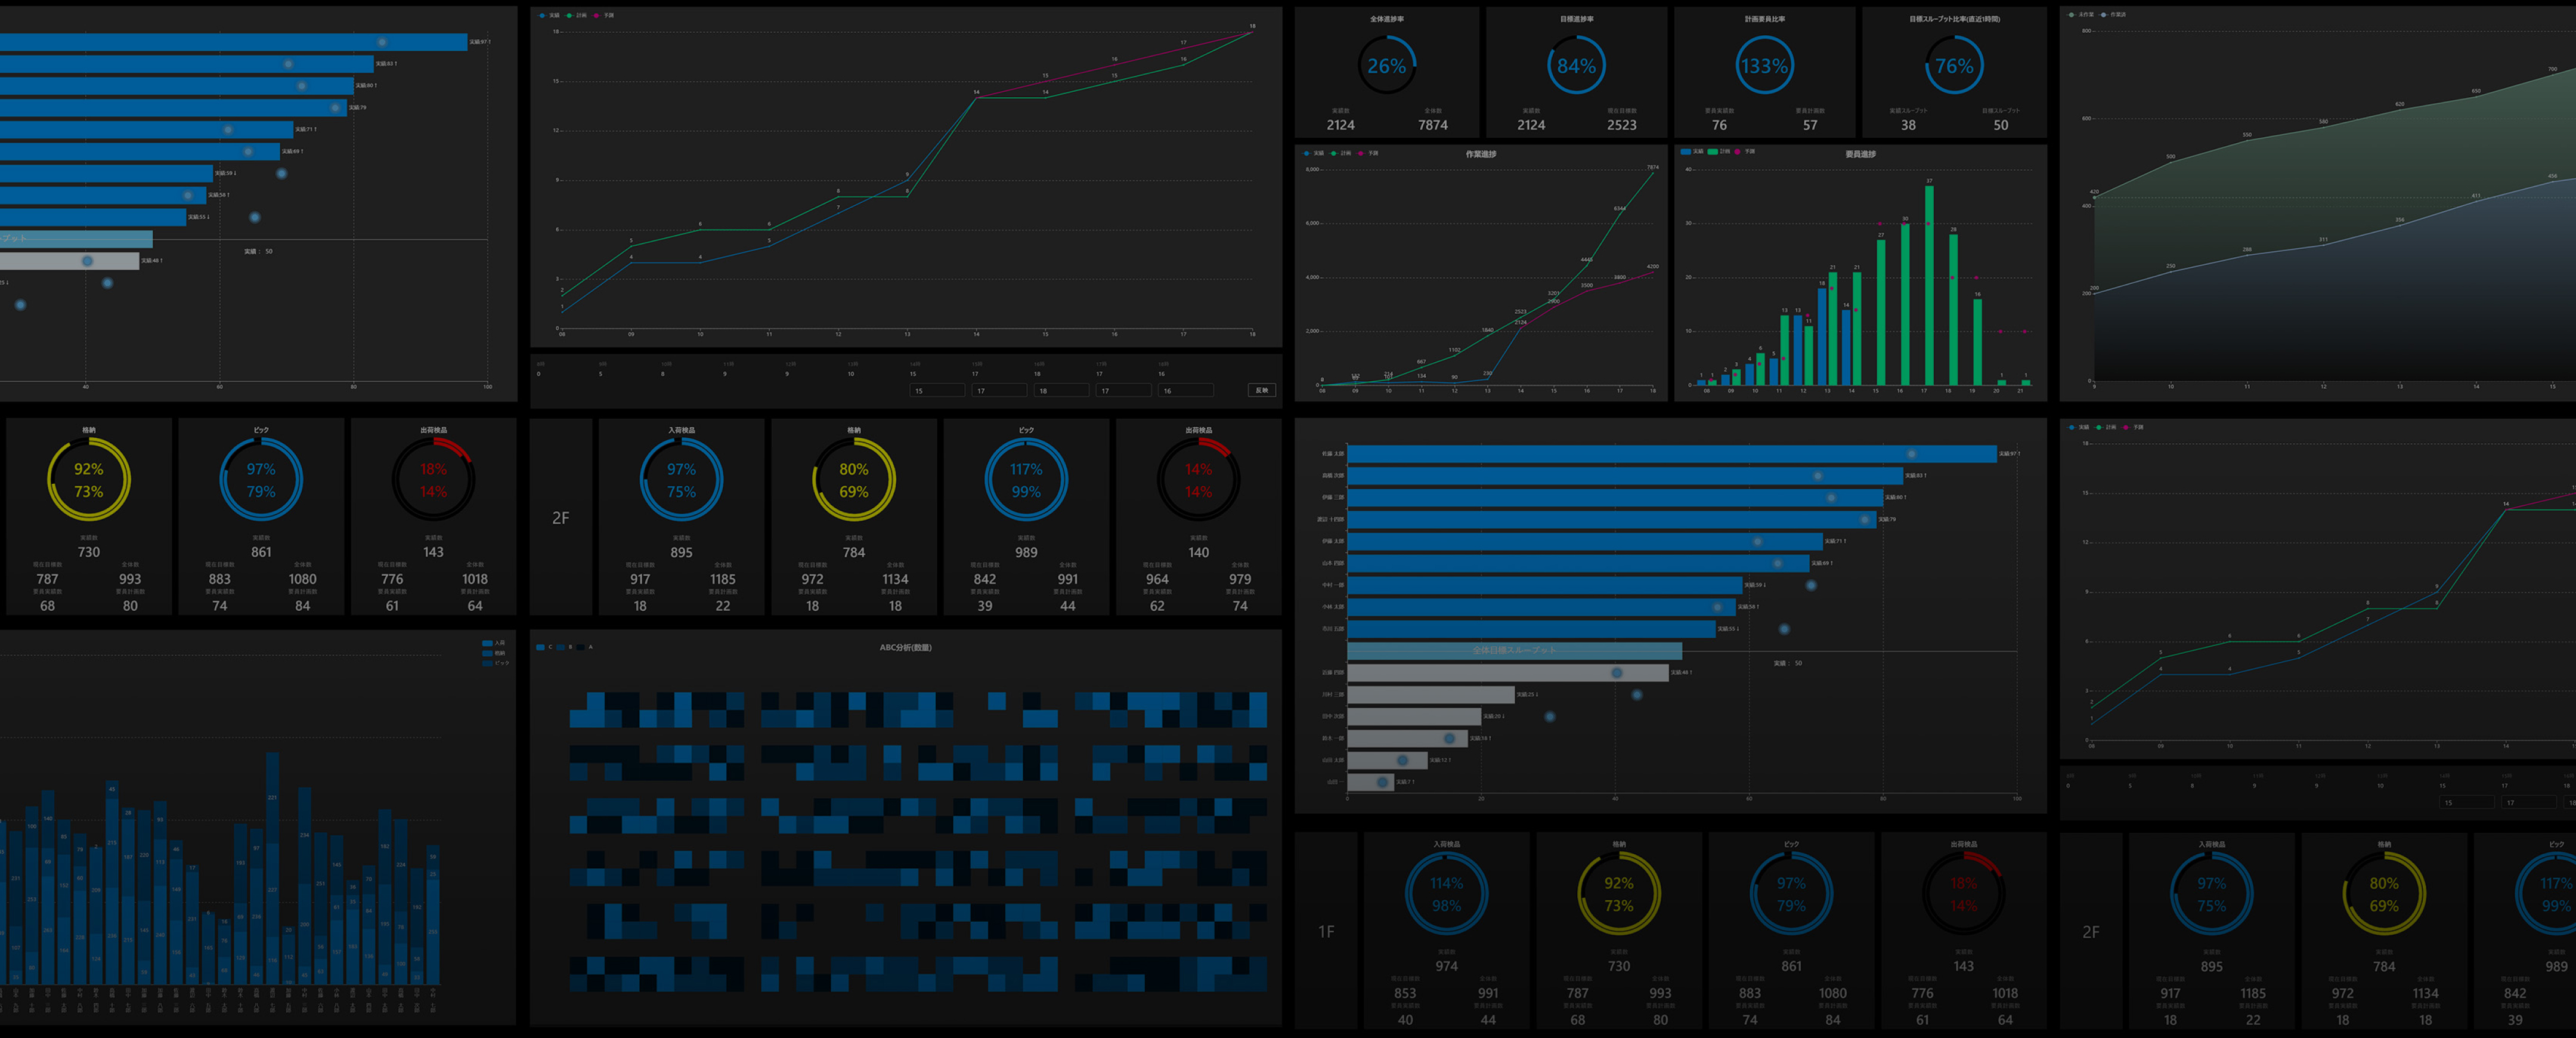
Workload Analyzer
-

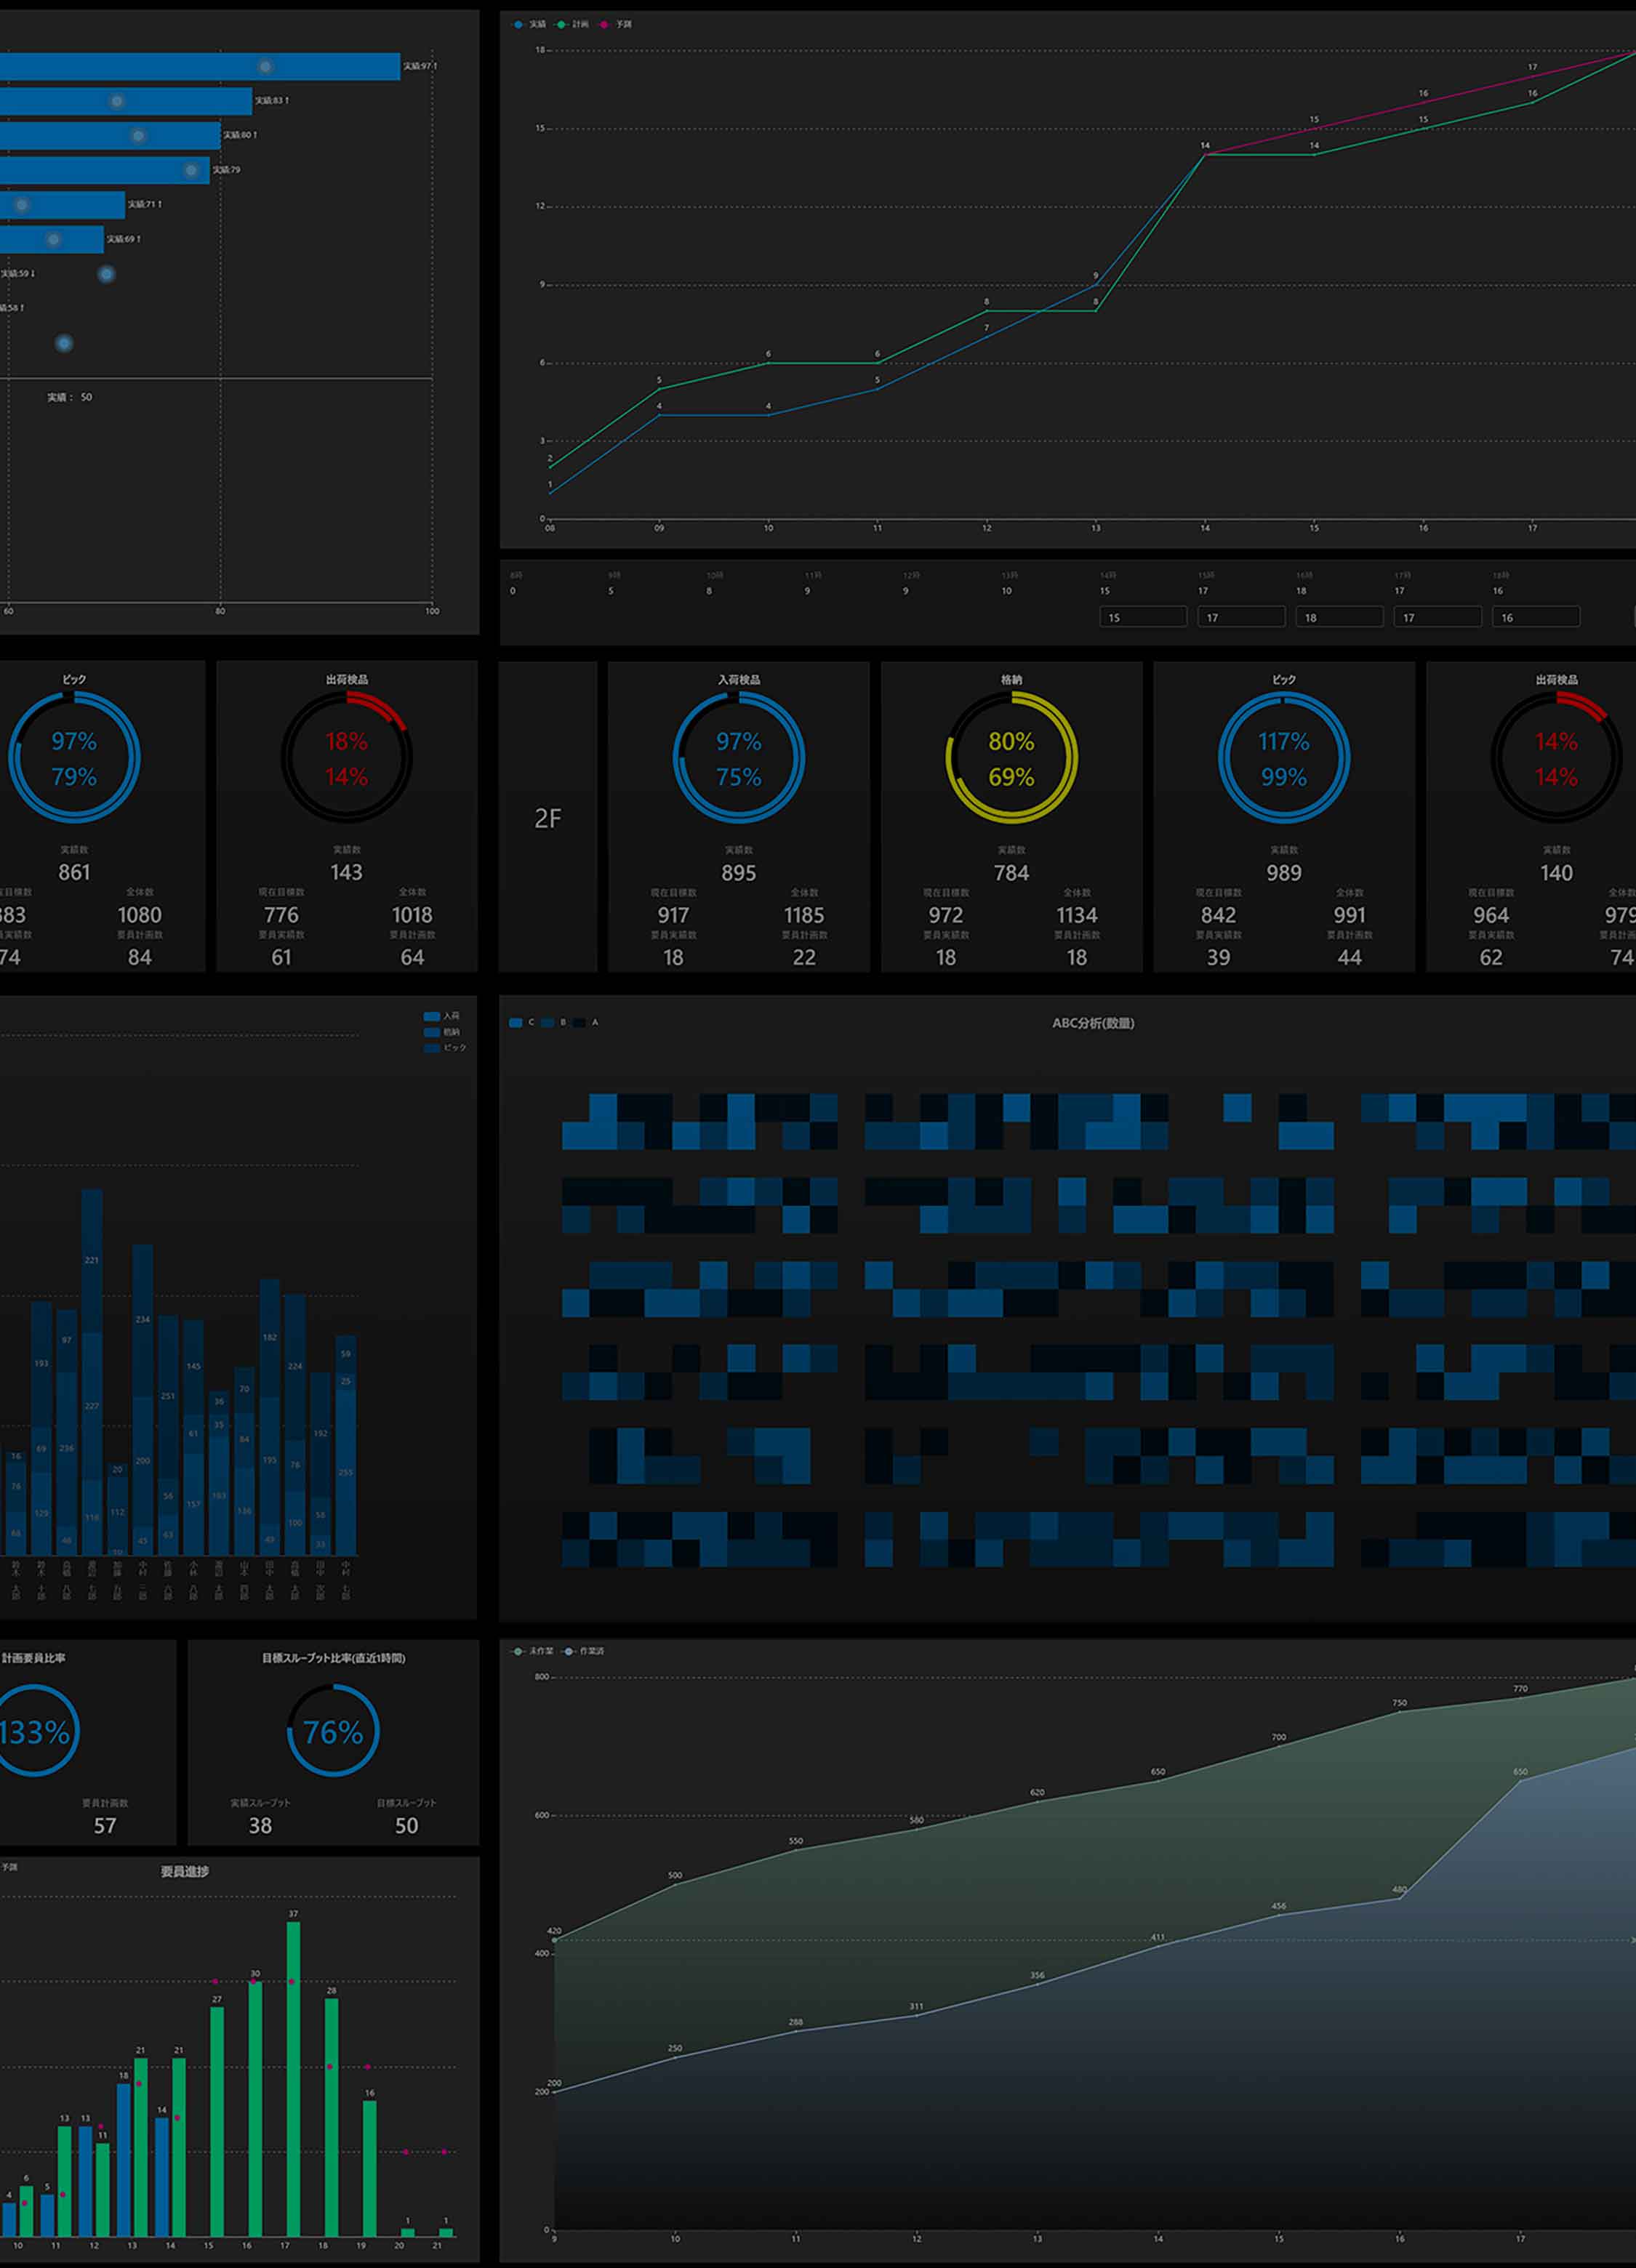
Workload Forecasting
Features
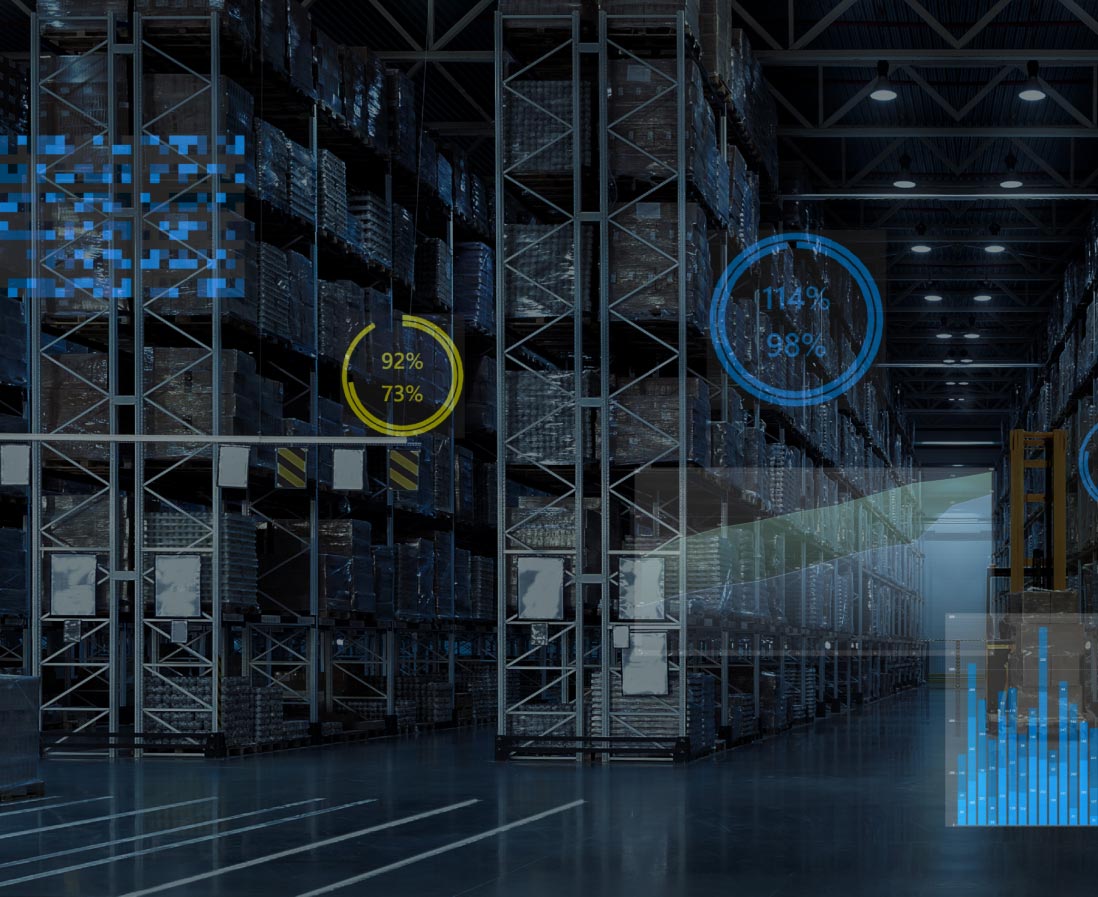
Real-time visualization of operational progress — For detecting troubles and taking prompt actions for recovery
GWES visualizes the progress of various work operations in logistics facilities in real-time. This enables monitoring and detection of troubles and decision-making for prompt recovery.
Aggregating, analyzing, and visualizing an array of data for the sophistication and operation of logistics facilities
GWES works seamlessly with various systems already in place — such as warehouse management systems (WMS) and warehouse control systems (WCS) — and analyses and visualises workload costs, skills and productivity from various perspectives, including daily, hourly and by staff. In addition to real-time monitoring, trends and problems can be identified and used to implement an efficient PDCA cycle and evaluate improvement activities. It can also be used for future shift improvements and staff training plans.
Workload forecasting by time-series analysis for highly accurate planning
Past work performance is analyzed using an AI time-series analysis model to produce highly accurate workload forecasts, considering the impact of events such as sales campaigns. Forecast results are reflected in staff allocation and the number of trucks needed, and can also be used for work progress analysis to support highly accurate forecasting and planning.